
Value Research has the figures: only five out of nearly 600 active schemes have made it past 15% on an annualised basis across all those time frames. The kind of short list that makes you rethink the rule book – when it comes to this sort of discipline, it’s the mid-cap and sector calls that come out on top, not the broad caps.

What the outliers reveal
They are SBI Healthcare Opportunities (Regular), UTI Healthcare (Regular), HSBC Midcap (Regular), ICICI Prudential Midcap and the DSP India T.I.G.E.R. (Regular). No flexi or large cap in the bunch, which is a telling sign of where the growth has been over the long run.
You have your two healthcare names, two mid-caps and one with an infrastructure bent. If you were in these for the ride, you let the SIP do its work, even while the rest of the market was shuffling around.

How a Rs 10,000 SIP compounded
Take a Rs 10,000 a month for 20 years as your measure and the HSBC Midcap Fund gives you the biggest pot at Rs 1.86 Cr. The others are close behind; it’s about having the fortitude to hold on.
Then there’s the ICICI Prudential Midcap with Rs 1.61 Cr, SBI Healthcare Opportunities at Rs 1.68 Cr and UTI Healthcare at Rs 1.45 Cr. The DSP India T.I.G.E.R. would have you at Rs 1.40 Cr.
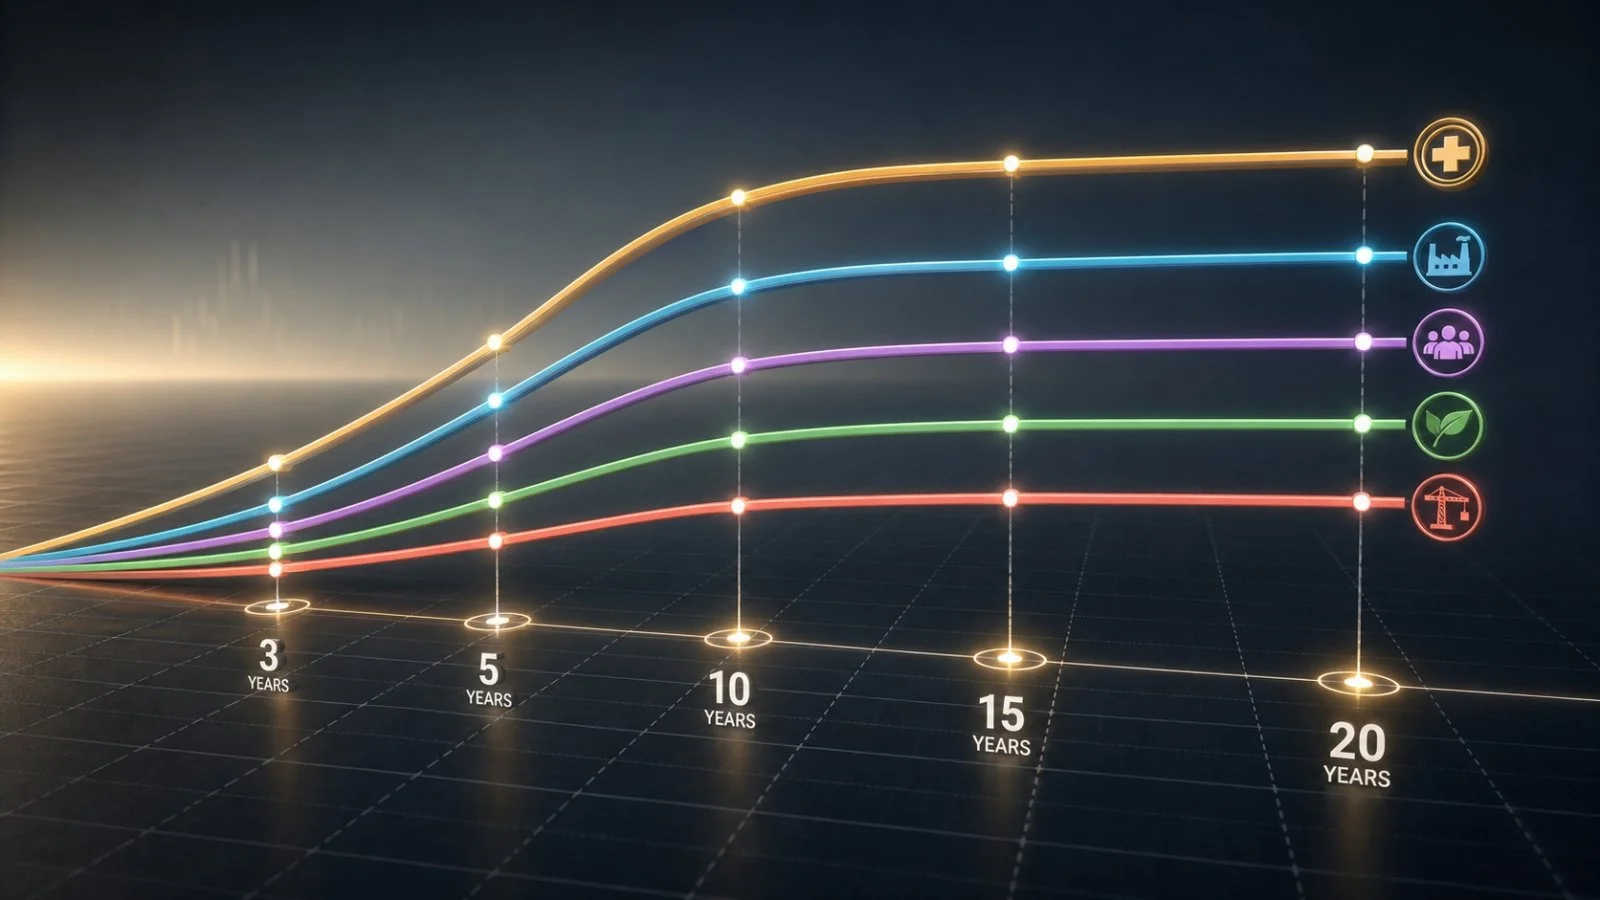
Across 3, 5, 10, 15, 20 years
Every one of them has made the 15% mark on the big horizons. In 5-year terms, for instance, the DSP India T.I.G.E.R. Reg was out in front at 22.25. UTI Healthcare Reg was 19.57, HSBC 21.46, ICICI 19.25 and SBI 20.87.
For 3-year returns, HSBC is 20.05, UTI 18.68, ICICI 17.34, DSP 16.60 and SBI 19.14. The variance here is more about steady hands than a one-off run.
Put in 10 years and you get 20.64 from the DSP fund, 17.87 from UTI, 18.77 for SBI, 18.49 for ICICI and 18.39 for HSBC. Stretch it to 15 and you see HSBC at 18.96, DSP at 18.09, ICICI 18.33, SBI 16.83 and UTI 15.50.
At the 20-year mark the field is closer: 15.40 for the DSP, 15.61 for UTI, 16.52 for ICICI, 16.80 for SBI and 17.70 for HSBC.
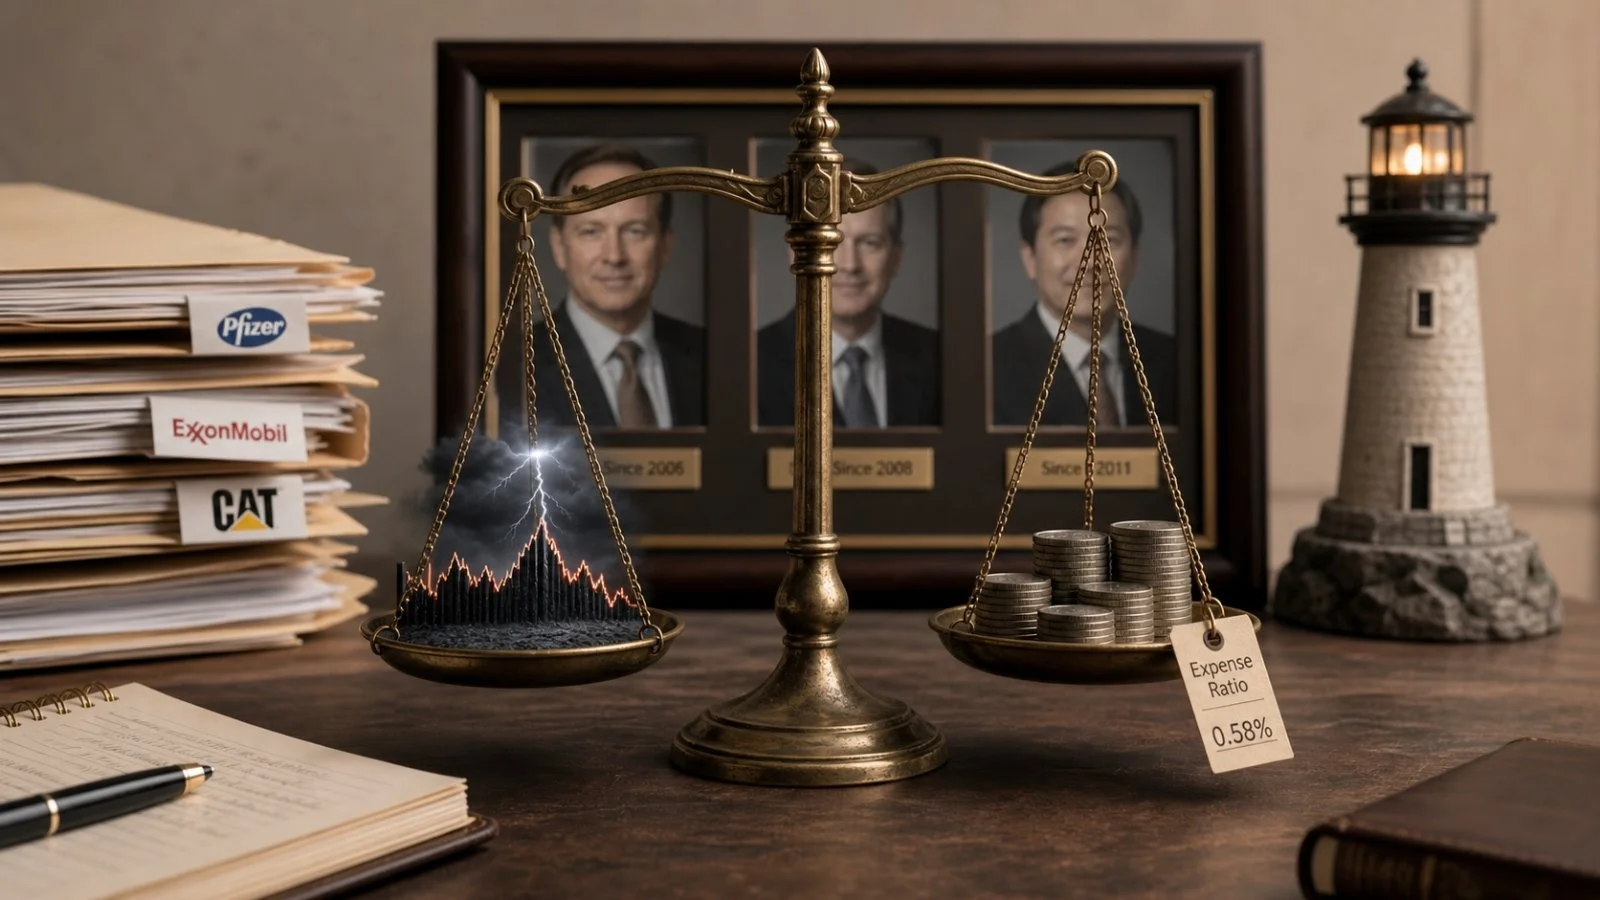
Risk, costs and leadership stability
SBI Healthcare Opportunities is no new kid on the block – it’s been in the game since July 5, 1999, with 16.64% in returns to show for it. Tanmaya Desai is at the helm and the expense ratio is 1.60%. His top picks are the likes of Sun Pharma, Divi’s, Acutaas, Apollo and Max.
Run the risk-adjusted numbers on the SBI scheme and you see a standard deviation of 14.8, a Sharpe of 1.18, Sortino of 1.97, with a 0.85 beta and 1.25 alpha.
Healthcare and materials are the heavy hitters in terms of sector exposure.
Take the UTI Healthcare Fund, for instance. Put in place by Kamal Gada on June 28, 1999, it has put up 14.93% since day one. With a 1.85% expense ratio, its mean return of 25.06% is a bit better than the BSE Healthcare TRI’s 24.92 and well above the 22.79 you see in the pharma category at large. You’ll find names like Sun Pharmaceutical, Divi’s Lab, Ajanta, Gland and Lupin in the portfolio. It is that kind of steady hand through the ups and downs of pharma that has made the fund’s SIP so reliable.
Then there is the HSBC Midcap Fund. Cheenu Gupta has been at the helm since it was first offered on August 9, 2004, and returns have been 19.08% to date (expense ratio: 1.45%). In the last three years alone, the fund has averaged 26.20% a year, which is some way in front of the 20.99 mark set by the BSE 150 MidCap TRI and the 19.95 mid-cap average. The book is made up of GE Vernova T&D, FSN E-Commerce, BSE, PB Fintech and Lenskart, with a mix of Financials, Industrials, Consumer Discretionary, Healthcare and Tech.
Lalit Kumar runs the ICICI Prudential Midcap Fund, which has given 17.61% since its 2004 debut. The 1.53% fee comes with an average annual return of 24.88% over the past three years, outpacing both the BSE 150 MidCap TRI and the category norm. BSE, MCX, Apar, Jindal Steel and Hindustan Petro are among the top picks, while Materials, Financials and Real Estate make up the bulk of the allocation.
Rohit Singhania has been managing the DSP India T.I.G.E.R. Fund since June 11, 2004. It has a 1.56% expense ratio and 17.66% in returns from the start. The last 3 years have seen an average of 25.64% – not quite as good as the 28.44% of its benchmark, the BSE India Infrastructure TRI, but still better than the 21.81 thematic average. On the risk-reward side, the Reg plan has a Sharpe of 0.97 and a beta of 0.69. You can spot Reliance, NTPC, Apollo Hospitals, L&T and Kirloskar in the holdings, with a lot of weight in Industrials and Energy.

Trailing scorecard
For some perspective on how things have been, here are the 3, 5 and 10-year trailing numbers from Value Research:
– HSBC Midcap Reg: 26.39, 19.06, 17.25
– SBI Healthcare Opportunities Reg: 23.87, 16.24, 13.67
– ICICI Pru Midcap: 23.80, 18.11, 16.78
– UTI Healthcare Reg: 25.44, 14.59, 13.78
– DSP India T.I.G.E.R. Reg: 25.04, 23.19, 17.95
Why consistency beats one-year stars
If you are an SIP investor, the one-year leaderboards can be a red herring. Look at the Quant Flexi Cap Fund: with more than Rs 2,000 crore in AUM and a few years under its belt, it has been the top dog for the year and is up 20% in just the last quarter. It is the only one of the bunch to be in the black year to date; the Bank of India Flexi Cap has made a nice recovery to do the same, whereas the ICICI Prudential version has dipped a little.
But if you look at the longer view, the Bank of India fund has the upper hand on annualised returns for three and five years. A monthly SIP of Rs 10,000 would have put you at about Rs 5 lakh in either the Bank of India or Quant after three years, with very little to separate them even at the five-year mark.
The point is obvious. When it comes to SIPs, what endures is better than what is in vogue. These five have been the long-run winners in Indian equities.